
Dar es Salaam Water Crisis: Structural Failure, Political Targeting, or Deliberate Sabotage?

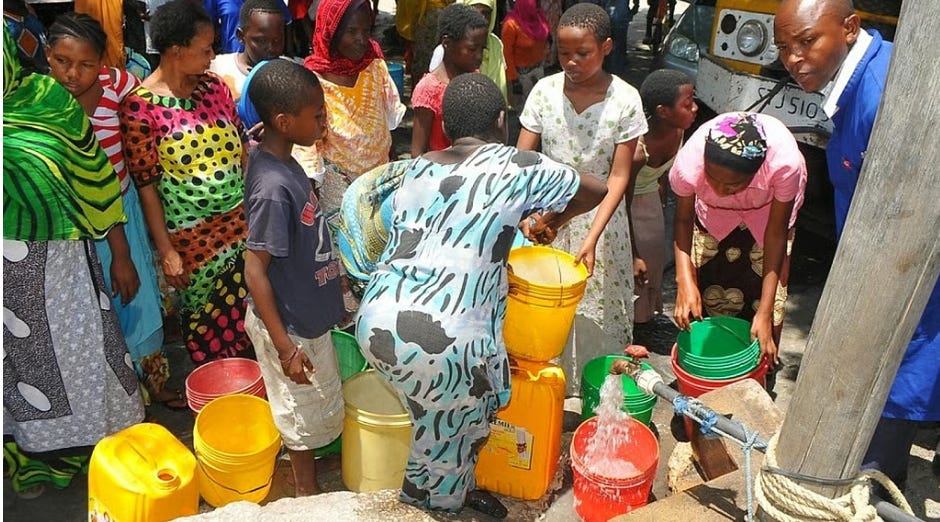
The December 2025 Dar es Salaam water crisis affecting six million residents results primarily from structural infrastructure failures (37% distribution losses, 270 million litre production shortfall) compounded by climate shocks (failed October-December rains), not deliberate political punishment. However, the crisis disproportionately impacts opposition strongholds during post-election repression, raising legitimate questions about regime prioritisation versus capacity in Tanzania’s largest city.
What Is the Scale and Scope of Dar es Salaam’s Current Water Crisis?
Production Collapse Metrics
The Dar es Salaam Water and Sanitation Authority (DAWASA) reports catastrophic production failures:
Lower Ruvu Treatment Plant Performance:
Previous capacity: 270 million litres/day
Current production: 50 million litres/day
Production collapse: 81.5% reduction
City-Wide Water Deficit:
Total daily demand: 770 million litres
Current production capacity: 534 million litres
Daily shortfall: 236 million litres (30.6% unmet demand)
Source: The Citizen, December 2024
Geographic Distribution of Service Interruptions
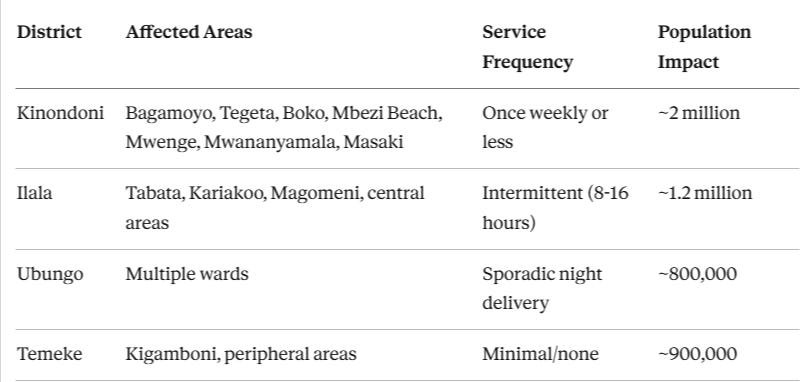
Critical Service Gap: Only 20% of Dar es Salaam residents receive water for 20-24 hours daily, whilst 40% lack pipeline network access entirely.
Source: The Citizen, December 2024
Economic Impact Quantification
Price Escalation:
Pre-crisis vendor water: $4 per 1,000 litres
Current vendor water: $10 per 1,000 litres
Price increase: 150%
Household Cost Burden:
Low-income areas (Tandale): 100-litre container costs exceed daily family food budget
Middle-income areas: Weekly water purchases average $15-25
Wealthier areas: Cushioned by private boreholes and storage tanks
Source: K24 Digital, December 2024; Down to Earth, December 2024
Is This a Structural Infrastructure Problem?
Evidence of Systemic Infrastructure Failure
Yes. Multiple structural deficiencies have created chronic vulnerability:
1. Massive Distribution Network Losses
DAWASA operational data reveals catastrophic inefficiency:
Daily production: 520 million litres
Daily sales: 210 million litres
Daily losses: 110 million litres
Loss rate: 37% (vs. International Water Association 20% benchmark)
Implication: If distribution losses were eliminated, DAWASA could theoretically serve 6 million additional residents with existing production capacity.
Source: The Guardian Tanzania, July 2024
2. Production Capacity-Utilisation Gap
Water Minister Jumaa Aweso’s July 2024 inspection revealed:
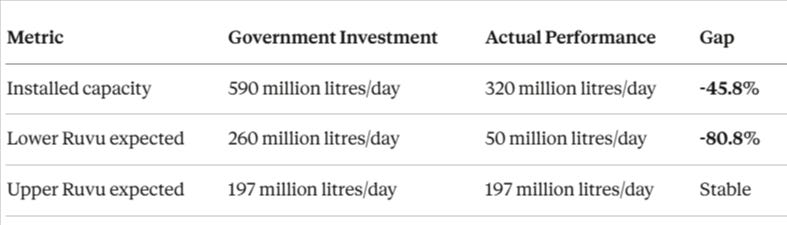
Cause identified: “Deliberate damage” to production facilities, machinery defects, inadequate maintenance.
Source: Down to Earth, July 2024
3. Delayed Major Infrastructure Projects
Kidunda Dam (Primary Long-Term Solution):
Budget: Sh329 billion (~$135 million USD)
Storage capacity: 190 billion litres
Projected service population: 11.39 million by 2032
Expected operational date: April 2026
Current status: Under construction, years behind schedule
Historical Context: Water rationing became routine in 2021, yet the transformative infrastructure solution remains 16+ months away.
Source: The Citizen, December 2024
4. Ageing Infrastructure and Network Inadequacy
Pipeline age: Significant portions exceed 30-40 years
Leak prevalence: Persistent throughout distribution network
Illegal connections: Widespread for irrigation and unauthorised use
Network coverage: 40%+ of city lacks pipeline access
Water expert Herbert Kashililah (Tanzania Water & Sanitation Network) confirmed: “Old pipelines are riddled with leaks and illegal connections... We must modernise this infrastructure by replacing old pipes, building new reservoirs, and upgrading treatment plants.”
Source: Down to Earth, July 2024
Climate Vulnerability: Structural Design Flaw
Dar es Salaam’s water system architecture is fundamentally vulnerable:
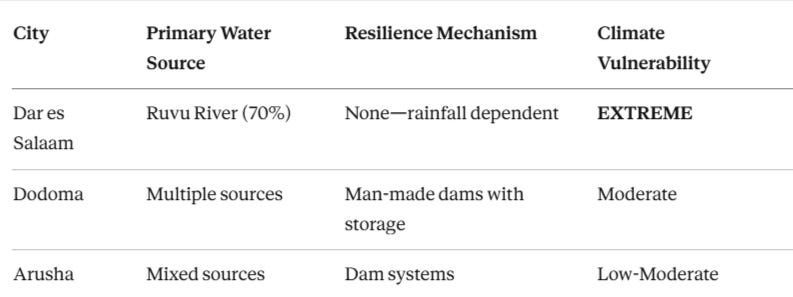
Critical Design Gap: Despite coastal location, Dar es Salaam has zero desalination capacity, leaving the city entirely dependent on inland rainfall patterns affecting the Ruvu River.
2024 Climate Shock:
Tanzania Meteorological Authority forecast: Below-average October-December 2024 rainfall
Actual outcome: Failed rainy season, “prolonged dry periods and unsatisfactory distribution”
Temperature anomaly: Moshi recorded 35.7°C (4.2°C above average), intensifying evaporation
Source: The Citizen, September 2024
Investment vs. Outcomes Discrepancy
Government Claims:
Sh1.19 trillion invested in water/sanitation projects over 4 years (2021-2025) under President Samia Suluhu Hassan
197 boreholes constructed under 2022 Prime Minister Kassim Majaliwa initiative
Multiple storage tank projects (e.g., Mshikamano tank 83% complete by September 2024)
Resident Reality:
Persistent rationing despite investments
Boreholes fail to alleviate scarcity during crisis periods
Water access percentage increased (89% to 93% claimed) but service quality/reliability declined
Analytical Assessment: Investment announcements do not translate to functional service delivery, suggesting implementation failure, corruption, or misallocated resources.
Source: The Citizen, December 2024